“Groundhog found fog. New snows and blue toes. Fine and dandy for Valentine candy. Snow spittin’; if you’re not mitten-smitten, you’ll be frostbitten! By jing-y feels spring-y.” ― The Old Farmer’s Almanac
Here in North Texas, February is typically a mix of cold weather with a few “spring-like” days. It is a shorter month and it just seems to go by very quickly. We all enjoy some love for Valentines Day and some get an extra day off for President’s Day. We hope that you were able to enjoy both. As far as real estate markets, the word is slow. Not crashing, not breaking but definitely slowing the pace it has been at. The numbers we are giving you are from January as we wait each month until all of the data comes in. Sale prices are just slightly up or even flat from the same time last year and down from last month. Marketing times are lengthening and supplies are beginning to increase- moving to a more balanced market. It is typically slower in the winter months as prices and volume pick up in the spring. Spring looks to be slower than what we have had in the last 3-5 years. The market has just let off of the accelerator in DFW. Here’s a look at the current numbers as well as recent some snapshots of the market. MAKE SURE TO HOVER OVER THE GRAPHS AS THEY ARE INTERACTIVE
The median sales price for single family homes for all four counties is down from last month but slightly up when compared to the same time last year. Here are the YoY stats:
JANUARY 2019 Denton County $299,990 | +2.0% Collin County $314,990 | +1.6% Dallas County $215,000 | 0.0% Tarrant County $220,000 | +3.3%
The median price per square foot for single family homes in all four counties is up from the same time last year. Collin, Dallas & Tarrant counties are down from last month and Denton is flat month to month. Here are the YoY stats:
JANUARY 2019 Denton County $136 | +2.3% Collin County $135 | +1.5% Dallas County $126 | +4.1% Tarrant County $119 | +7.2%
The supply of inventory for all four counties is increasing. All but Collin county increased month to month. There has been an increase in construction which has helped with the inventory. The official numbers for building permits is not yet available due to the delays in the government shutdown. We will share those next month if they are available. Here are the YoY stats for supply in all four counties:
JANUARY 2019 Denton County 2.8 | +47.4% Collin County 3.0 | +36.4% Dallas County 2.7 | +35.0% Tarrant County 2.0 | +25.0%
The volume is slowing down. In all four counties, the number of closed sales was down from the month before and all four counties are posting double-digit declines from the same time last year. Here are the YoY stats:
JANUARY 2019 Denton County 686 | -14.7% Collin County 773 | -12.1% Dallas County 1,270 | -14.0% Tarrant County 1,393 | -12.8%
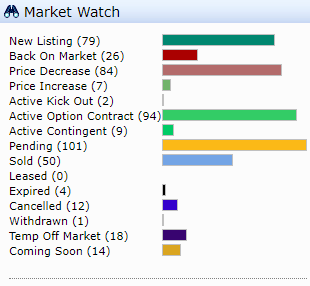
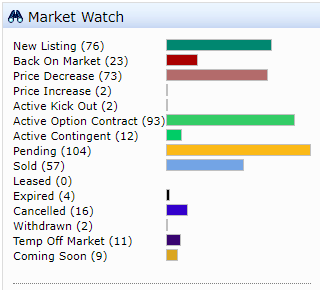
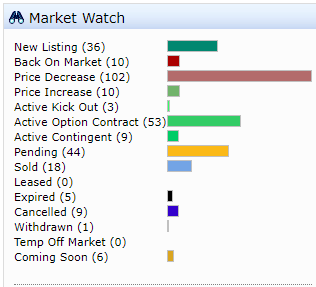
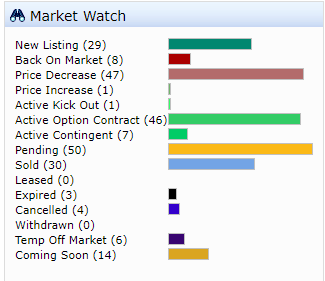
Current Market Activity – We thought we would share a little insight into what is currently occurring in the markets. This is a 24-hour snapshot of each county. You can see that all of them have just as many price decreases as listings with Collin and Denton counties showing more decreases than the number of new listings. This may be even more telling of a slower spring selling season ahead.
DALLAS COUNTY
TARRANT COUNTY
COLLIN COUNTY
DENTON COUNTY
We hope that you found this helpful. A reminder that these are general market trends and metrics. These may not apply to your specific property as there are so many different factors that impact the value of individual properties.
Shannon is a Certified Residential Real Estate Appraiser and serves as the Vice President of the DW Slater Company. She joined David at the DW Slater Company in 2006. Shannon graduated Cum Laude from the University of North Texas with a BA degree. Prior to joining the DW Slater Company, she was an Elementary School Teacher for the Pilot Point Independent School District. Shannon is an FHA Certified Appraiser. Shannon is a designated member of the National Association of Appraisers and a member of the Association of Texas Appraisers. In her free time, Shannon enjoys spending time with her family, singing in a local church choir, and tandem cycling with her husband.
Happy February to you. I hope all is well with you and your family. I really dig these interactive graphs. It looks like they come from your MLS. They’re sharp. I don’t think I realized you could hover over them before to see the exact data from a given month.
Happy February to you and congratulations on your 10 year anniversary of your blog! A decade of great appraisal blogging!! And yes, I am thrilled to be able to add these graphs as I couldn’t on my old platform. Perhaps, I need to draw a bit more attention to the interactive features of them. They are from our trends data from our mls. I love them because I can customize the data to input into the chart. Pretty cool.