May Newsletter- Rural Counties Surge
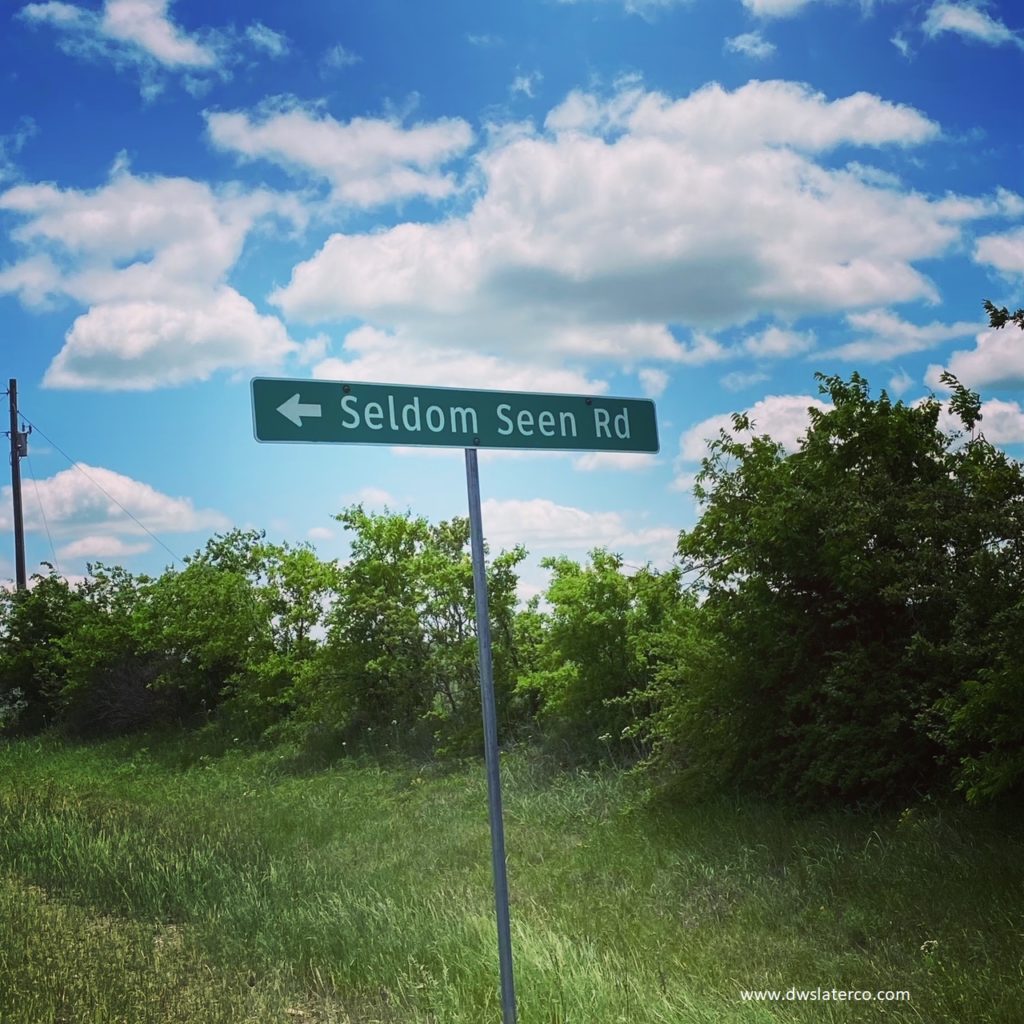
When appraising, especially in our rural market areas, we drive around and see many things, including unusual names for streets. This sign in Montague county is one of our favorites and speaks to the affinity for being away from the hustle and bustle of the larger metropolitan areas. This past year, the pandemic has really been a disrupter for many facets of our lives but the impact on real estate has been significant. Prices were rising but have accelerated even more this past year as many were looking to move or upgrade their homes, taking advantage of the low-interest rates. Demand has been high and the supply low, driving prices up. We appraise in our main counties but also in some of the surrounding rural counties. Our rural counties have seen a surge in the number of sales. The desire to have a piece of land away from it all has been strong. Land prices have really ticked up during the pandemic. This month we’ve included both our regular counties as well as some data from our rural counties. Don’t forget that the links are clickable and you can further explore the data.
Median Sales Price- Dallas, Tarrant, Denton & Collin Counties
Median Price Per Sq Ft- Dallas, Tarrant, Denton & Collin Counties
$151 | +7.9%
Days on Market- Dallas, Tarrant, Denton & Collin Counties
13 | -55.2%
Months Supply- Dallas, Tarrant, Denton & Collin Counties
1.3 | -55.2%
Volume-Dallas, Tarrant, Denton & Collin Counties
17,698 | +10.2%
Rural Counties
Median Sales Price- Cooke, Grayson, Wise & Parker Counties
$255,000 | +21.1%
Median Price Per Sq Ft- Cooke, Grayson, Wise & Parker Counties
$134 | +13.6%
Days on Market-Cooke, Grayson, Wise & Parker Counties
36 | -14.3%
Months of Supply- Cooke, Grayson, Wise & Parker Counties
2.2 | -57.7%
Volume- Cooke, Grayson, Wise & Parker Counties
518 | +10.2%
Mortgage rates have remained low with many below 3% and construction costs continue to sky rocket. All of these market areas continue to see price increases, low supply, and high demand. As we come out of the pandemic, we will continue to keep an eye on shifts in the market.
Also, it is of note, that these statistics are general for all sales within the entire county, each home will be in a submarket that may be higher or lower, depending on the market. These are general trends and should not be applied to specific homes. In other words, if you live in Denton County, just because the general trend is 8% higher prices, does not necessarily mean your home is worth 8% more than last year.
New Blog Posts
We have a couple of new posts on the blog! Check them out!

Let us know what questions you have about our markets or real estate appraising. We’d be glad to help out. If you aren’t already on our newsletter, please sign up below.
About The Author
Shannon Slater
Shannon is a Certified Residential Real Estate Appraiser and serves as the Vice President of the DW Slater Company. She joined David at the DW Slater Company in 2006. Shannon graduated Cum Laude from the University of North Texas with a BA degree. Prior to joining the DW Slater Company, she was an Elementary School Teacher for the Pilot Point Independent School District. Shannon is an FHA Certified Appraiser. Shannon is a designated member of the National Association of Appraisers and a member of the Association of Texas Appraisers. In her free time, Shannon enjoys spending time with her family, singing in a local church choir, and tandem cycling with her husband.
I love that street name. In my area we have a road called “No Name Road,” and there is another called “Throwitaway” because it’s close to a dump. Haha.
Your market looks very similar to mine.
Thanks, Ryan! Yes, I love the different names that we see. No Name Road and Throwitaway are great! I keep thinking I will compile of collection of the interesting names we see and make a post about it. We have Never Mind Road, Two Bush Road, This Way & That Way Road, …… stay tuned, one day I might compile this one